A Large-Scale Database for Graph Representation Learning
What is graph representation learning?
In Euclidean space, we can easily determine an object’s class by looking at it’s neighbors (see right-half of Figure 1). However, when working with graph data, how do we compare graphs?
This is a key question that has been studied for decades. However, the recent emergence of graph data across many scientific fields has led to intense interest in developing new graph representation techniques that can better encode structured information (i.e., graphs) into low dimensional space for a variety of important tasks (e.g., toxic molecule detection, community clustering, malware detection).

In Figure 1 above, we show an example of how graph representation learning can be used for the important task of predicting if an unknown molecule is toxic or benign.
We have a set of known good molecules (green) and a set of known bad molecules (red) which we have transformed into 2-D space using a graph representation learning technique (i.e., dimensionality reduction).
Now that we have the set of known graphs in 2-D space, we can ask easily answer questions like is this unknown molecule benign or toxic? In the case of our example, the molecule is closer to the benign molecules, therefore it is likely benign.
What’s holding graph representation learning back?
Recent research focusing on developing graph kernels, neural networks and spectral methods to capture graph topology has revealed a number of shortcomings of existing graph benchmark datasets, which often contain graphs that are relatively:
(1) limited in number,
(2) small in scale in terms of nodes and edges, and
(3) restricted in class diversity.
The state of graph representation benchmark datasets is analogous to MNIST at its height — a staple of the computer vision community, and often the first dataset researchers would evaluate their methods on. The graph representation community is at a similar inflection point, as it is increasingly difficult for current graph databases to characterize and differentiate modern graph representation techniques.
How do we advance the field?
In order to solve these issues, we have been working to develop the worlds largest public graph representation learning database to date at Georgia Tech’s Polo Club of Data Science.
We recently released MalNet, which contains over 1.2 million function call graphs (FCGs), averaging over 17k nodes and 39k edges per graph, across a hierarchy of 47 types and 696 families of classes. Compared to the popular REDDIT-12K database, MalNet offers 105x more graphs, 44x larger graphs on average, and 63x more classes.

FCGs, which represent the control flow of programs (see Figure 2), can be statically extracted from many types of software (e.g., EXE, PE, APK), we use the Android ecosystem due to its large market share, easy accessibility, and diversity of malicious software.
With the generous permission of the AndroZoo we collected 1,262,024 Android APK files, specifically selecting APKs containing both a family and type label obtained from the Euphony classification structure

How do we download and explore MalNet?
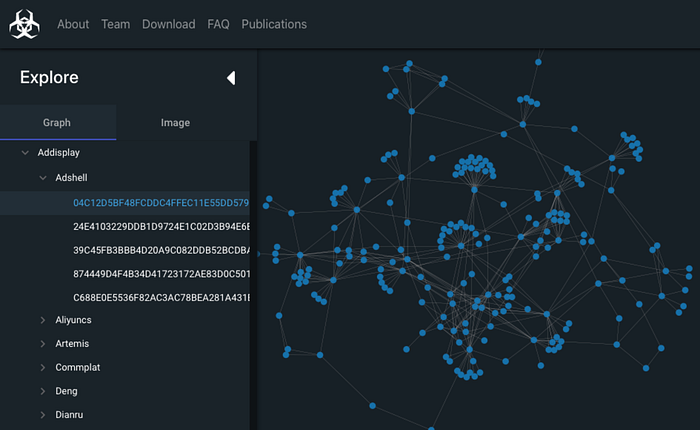
We have designed and developed MalNet Explorer, an interactive graph exploration and visualization tool to help people easily explore the data before downloading. Figure 3 shows MalNet Explorer’s desktop web interface and its main components. MalNet Explorer is available online at: www.mal-net.org

Enabling New Discoveries
Current graph representation datasets are significantly smaller in scale, and much less diverse compared to MalNet. In light of this, we study what new discoveries can be made, that were previously not possible due to dataset limitations. We find the following 3 discoveries:
- Less Diversity, Better Performance. The classification task becomes increasingly difficult as diversity and data imbalance increase.
- Simple Baselines Surprisingly Effective. For the first time, using the largest graph database to date, our result confirms that advanced techniques in the literature do not well capture non-attributed graph topology.
- Training Data Governs Performance. We find that certain graph types have a large jump in predictive performance, while others increase linearly, or not at all.
Enabling New Research Directions
The unprecedented scale and diversity of MalNet opens up new exciting research opportunities for the graph representation community, including:
- Class Hardness Exploration is now possible to explore why certain classes are more challenging to classify than others due MalNet’s large class diversity.
- Imbalanced Classification Research in the graph domain has yet to receive much attention, largely because no datasets existed. By releasing MalNet, with imbalance ratios of 7,827x (type)and 16,901x (family), we hope foster interest in this area.
- Reconsidering Merits of Simpler Graph Classification Approaches. From D2, we find that simpler methods can match or outperform more recent and sophisticated techniques, suggesting that current techniques have trouble capturing to capture non-attributed graph topology. We believe our results will inspire researchers to reconsider the merits of simpler approaches and classic techniques.
- Enabling Explainable Research. We observe that certain representation techniques better capture particular graph types across MalNet’s nearly 700 classes. This is a highly interesting result, as it could provide insight into when one technique is preferred over another (e.g., local neighborhood structure, global graph structure, graph motifs).
